【Python】画像から GeoJSON / KML ファイルを作る
小ネタ(遊び)です。画像から GeoJSON / KML ファイルを作る方法について説明します。
まず、読み込む画像をペイントなどで作成します。サイズは高さ 50 px、幅200 px 程度がおすすめです。作成したら、拡張子を PNG にして保存します。以下が作成した画像の例です。
次に、以下のような Python ファイルを作成します。コードはシンプルなので、中身の説明は割愛します。標準ライブラリの他に、NumPy、Pillow、geojson が必要な為、まだインストールされてない方は pip install してください。
import glob
import os
import numpy as np
from PIL import Image
import geojson
from xml.etree.ElementTree import Element, SubElement, tostring, ElementTree

# 画像パスの取得
image_paths = glob.glob('./*.png')

for image_num in range(len(image_paths)):

    # グレースケール画像の読み込み
    image_path = image_paths[image_num]
    print(f'画像の読み込み: {image_path}')
    image = Image.open(image_path).convert('L')
    image_array = np.array(image)

    # 黒またはグレーのピクセルの座標を取得(閾値を128とする)
    threshold = 128
    dark_pixels = np.argwhere(image_array <= threshold)

    # Y座標を逆にして左下を基準にする
    height, width = image_array.shape
    dark_pixels[:, 0] = height - dark_pixels[:, 0] - 1

    # 座標を経緯度に変換
    dark_pixels[:, 0] = dark_pixels[:, 0] - height / 2
    dark_pixels[:, 1] = dark_pixels[:, 1] - width / 2
    if width >= height * 2:
        normalized_dark_pixels = dark_pixels / width * 200
    else:
        normalized_dark_pixels = dark_pixels / height * 100

    # GeoJSONのFeatureリストを作成
    features = []
    for pixel in normalized_dark_pixels:
        y, x = pixel
        point = geojson.Point((x, y))
        feature = geojson.Feature(geometry=point)
        features.append(feature)

    # GeoJSONファイルの作成
    feature_collection = geojson.FeatureCollection(features)
    output_path = os.path.splitext(os.path.basename(image_path))[0] + '.json'
    with open(output_path, 'w') as f:
        geojson.dump(feature_collection, f)
    print(f'GeoJSONファイルが作成されました: {output_path}')

    # KMLファイルの作成
    kml_output_path = os.path.splitext(os.path.basename(image_path))[0] + '.kml'
    kml = Element('kml', xmlns="http://www.opengis.net/kml/2.2")
    document = SubElement(kml, 'Document')
    for pixel in normalized_dark_pixels:
        y, x = pixel
        placemark = SubElement(document, 'Placemark')
        point = SubElement(placemark, 'Point')
        coordinates = SubElement(point, 'coordinates')
        coordinates.text = f'{x},{y},0'
    tree = ElementTree(kml)
    tree.write(kml_output_path, encoding='utf-8', xml_declaration=True)
    print(f'KMLファイルが作成されました: {kml_output_path}')
ちなみに「Python 環境ないよ、構築はめんどくさい」という方のために exe も用意しました。以下のボタンからダウンロードできます。色々とセキュリティ上の警告が出ますが、当サイトを信用する方のみ実行してください(本当は Python 推奨)。Windows でのみ実行でき、容量 20MB ぐらいです。
画像(PNG ファイル)と同じ階層に Python ファイルもしくは exe をおいて、実行(exe の場合はダブルクリック)すれば、GeoJSON と KML ファイルが出力されます。
出力された GeoJSON / KML を QGIS(地理ソフト)で確認すると以下のような感じです。「地理界隈じゃないし、QGIS とかダウンロードしてないよ」という方は、Google My Map が KML に対応しているので、そちらで見てみてください。なお Google Map のスクリーンショットは利用規約違反に当たるため(参考)ここでは割愛します。地理院地図に GeoJSON もしくは KML をドラッグアンドドロップしても確認することができます。
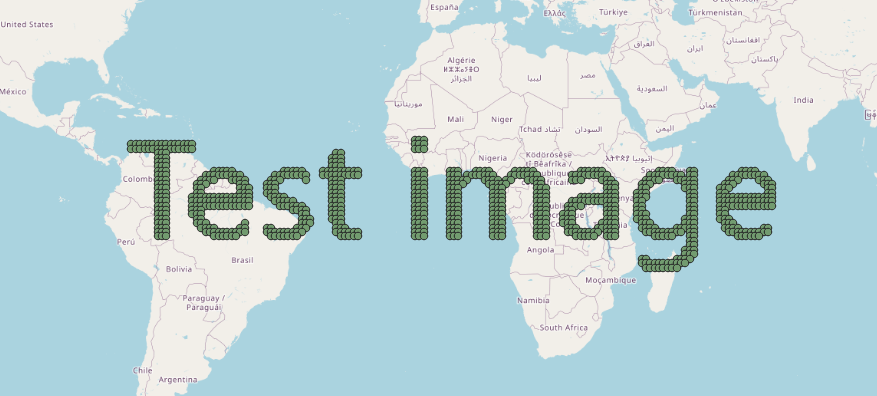
© OpenStreetMap contributors
ちょっと宣伝
当サイトは地図を使った海外旅ブログ/YouTube まとめサイトとなっています。トップページに地図がありますが、地名を押すと画像が開き、画像を押すと関連記事一覧(クリック数順)が開きます。記事数が多い国ほど赤く、地名もその国で記事が多い都市の文字が大きくなるようにしています。ぜひ覗いてみてください。
当サイトで海外旅ブログを執筆することも可能です(無料)! また既にブログ/ YouTube をお持ちの方も、当サイトからリンクを貼ることができるようになっています。気になる方は「当サイトについて」をご覧ください。
パントレ管理部